Executive Summary World Robotics 2017 Industrial Robots From IFR
2016: Continued accelerating growth
In 2016, robot sales increased by 16% to 294,312 units, a new peak for the fourth
year in a row. The main driver of the growth in 2016 was again – like in 2015 – the
electrical/electronics industry (+41%). Robot sales in the automotive industry increased,
like in 2015, at a rather moderate rate (by 6%) after a considerable increase between
2010 and 2014. The automotive industry is still the major customer of industrial robots
with a share of 35% of the total supply in 2016. The electrical/electronics industry has
been catching up, specially in 2015 and 2016, reaching a share of 31% of the total supply
in 2016. The electrical/electronics industry has become the most important customer in
almost all major Asian markets, e.g. China, Japan, Republic of Korea.
Since 2010, the demand for industrial robots has accelerated considerably due to the
ongoing trend toward automation and continued innovative technical improvements in
industrial robots. Between 2011 and 2016, the average robot sales increase was at 12%
per year (CAGR). The number of robot installations had never increased so heavily
before. Between 2005 and 2008, the average annual number of robots sold was about
115,000 units. 2009 is excluded because of the global economic and financial crisis
which caused an exceptional plunge in robot sales that year. In 2010, robot investments
which had been restrained in 2009 were the main driver of the significant increase.
Between 2011 and 2016, the average annual supply rose to about 212,000 units. This is
an increase of about 84% compared to the average annual supply between 2005 and
2008 and a clear indication of the tremendous rise in demand for industrial robots
worldwide.
Executive Summary World Robotics 2017 Industrial Robots
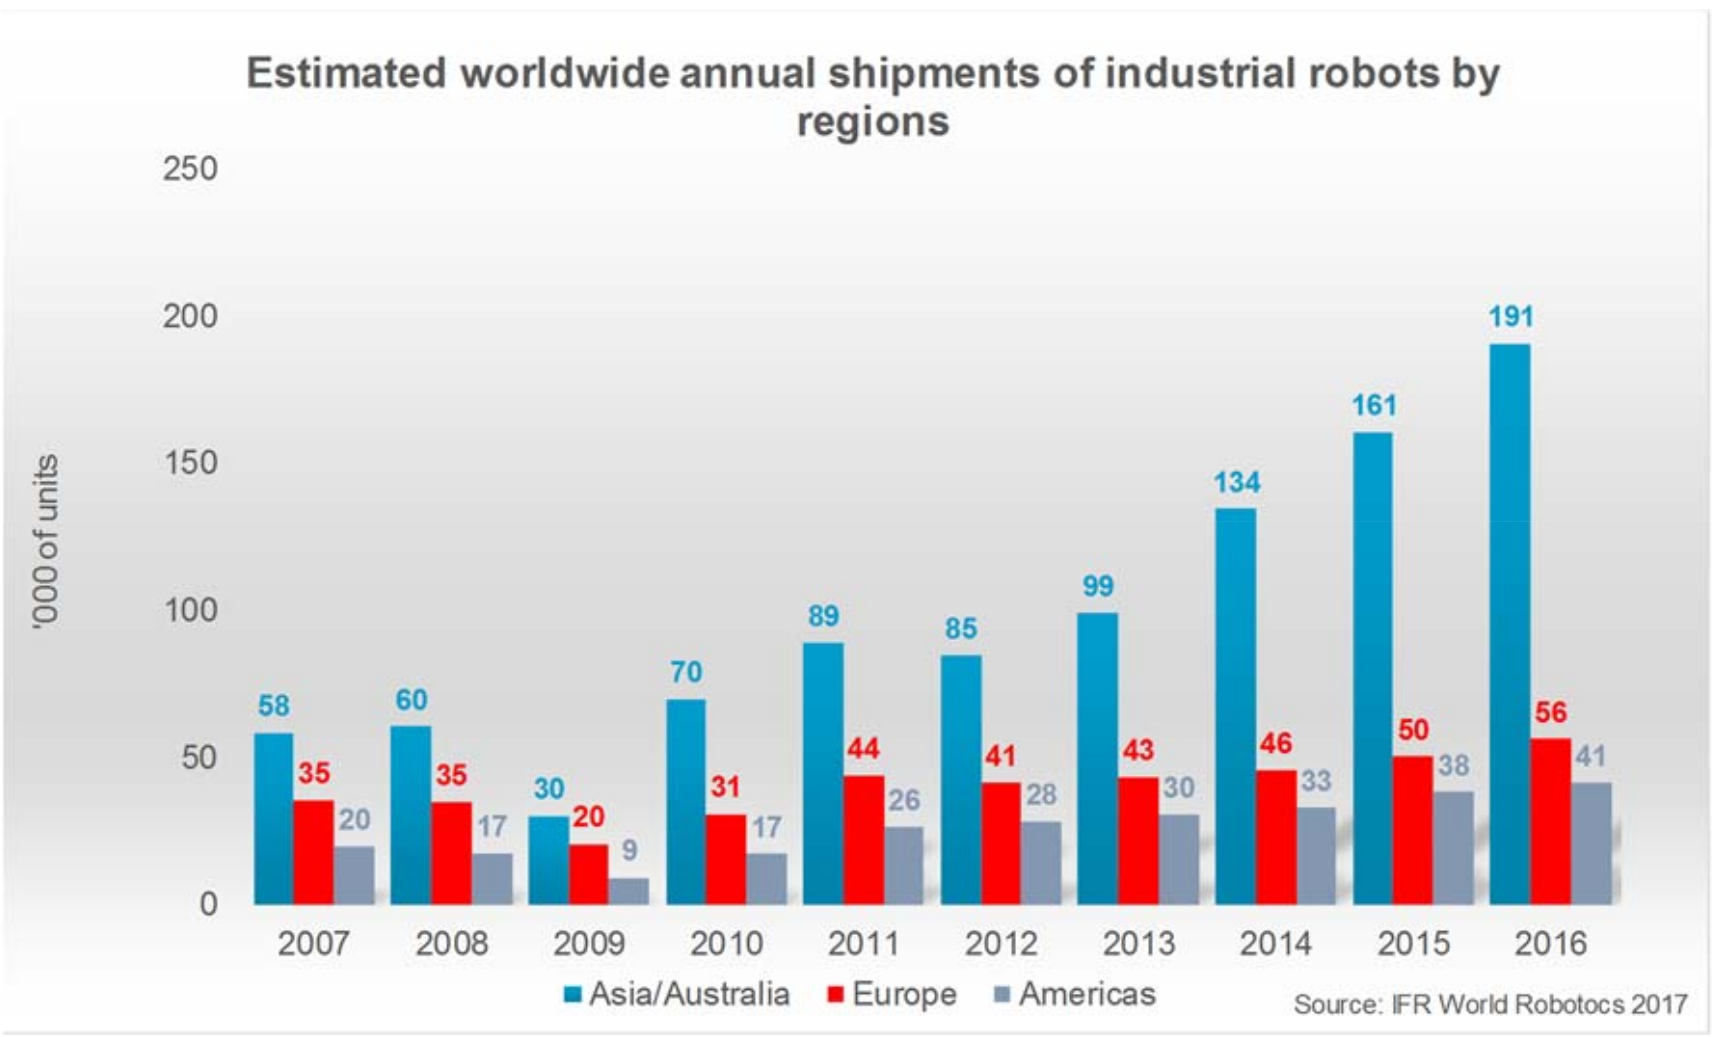
Continued considerable increase in all regions
Asia16 is still the world’s strongest growth market. This region saw a total of 190,492 units
sold in 2016 – a rise of 19%. This was the highest sales level ever recorded for the fourth
year in a row. Industrial robot sales in the second largest market, Europe, increased by
12% to 56,000 units (a new peak, for the third year in a row). About 41,300 industrial
robots were shipped to the Americas, 8% more than in 2015, establishing a new peak
for the fifth year in a row.
74% of the global robot sales in five countries
There are five major markets representing 74% of the total sales volume in 2016: China,
the Republic of Korea, Japan, the United States, and Germany. Since 2013 China
has been the biggest robot market in the world with a continued dynamic growth.
China has significantly expanded its leading position as the biggest market with a share
of 30% of the total supply in 2016 (27% in 2015). With sales of about 87,000 industrial
robots in 2016 – an increase of 27% compared to 2015 – China came close to the total
sales volume of Europe and the Americas together (97,300 units). Chinese robot
suppliers continued to expand their market share from 25% in 2013 to 31% in 2016.
Between 2011 and 2016, total supply of industrial robots increased by about 31% per
year on average. (For more details see chapter 3.3.1.)
About 41,400 units (8% more than in 2015) were sold to the Republic of Korea, the
second biggest market. Due to major investments of the electrical/electronics industry in
robots, annual sales increased considerably in 2016. Between 2011 and 2016, robot
sales increased by 10% on average per year (CAGR). (For more details see chapter
3.3.5.)
In 2016, robot sales in Japan increased by 10% to about 38,600 units, reaching the
highest level since 2006 (37,400 units). Robot sales in Japan followed a decreasing trend
between 2005 (reaching the peak at 44,000 units) and 2009 (sales dropping to only
12,767 units). Between 2011 and 2016, robot sales increased by 7% on average per
year (CAGR). (For more details see chapter 3.3.4.)
Increase in robot installations in the United States continued in 2016, by 14%, to the
peak of 31,400 units. Driver of this continued growth since 2010 was the ongoing trend
to automate production in order to strengthen American industries on the global market
and to keep manufacturing at home, and in some cases, to bring back manufacturing
that had previously been sent overseas. (For more details see chapter 3.2.2.)
Germany is the fifth largest robot market in the world. In 2016, the number of robots sold
increased slightly to 20,039 units compared to 2015 (19,945 units). Between 2011 and
2016, annual sales of industrial robots more or less stagnated at around 20,000 units.
(For more details see chapter 3.4.11.)
16Australia and New Zealand included in the category
Executive Summary World Robotics 2017 Industrial Robots
Other important Asian markets
Since 2013, Taiwan has ranked sixth among the most important robot markets in the
world regarding the annual supply. Robot installations increased considerably between
2011 and 2016, by 15% on average per year (CAGR). In 2016, robot sales increased by
5% to about 7,600 units, a new peak. Thailand is also a growing robot market in Asia.
However, sales have declined since 2014 reaching 2,646 units in 2016. The peak was
reached in 2012 with about 4,000 units. Robot sales increased by 27% to a new peak of
2,627 units in India, almost the same level as in Thailand. Robot supplies to other
Southeast Asian countries like Vietnam, Singapore and Malaysia substantially increased
in 2016. (For more details see chapter 3.3.)
Other important European markets
Italy has ranked 7th since 2014 regarding the worldwide annual supply of industrial
robots. Robot investments were slightly down in 2016 from the peak of 6,700 units in
2015. The French robot market was up by 39% to a new peak level. In Spain, sales of
industrial robots rather moderately increased to a new peak of 3,900 units. Sales of
industrial robots in the United Kingdom increased for the first time since 2012. Robot
installations in all other Western European and in all Nordic countries were
significantly up in 2016, as in 2015. Sales in most Central and Eastern European
markets also increased, except in the Czech Republic and Poland. Sales in Turkey
continued to increase in 2016. (For more details see chapter 3.4.)
Other important American markets
Mexico has become an important emerging market for industrial robots. Robot sales
further increased to about 5,900 units in 2016, again a new peak. In Canada, robot sales
were down from the peak of about 3,500 units in 2015 to 2,300 units in 2016. Robot sales
in Brazil decreased in 2016. (For more details see chapter 3.2.)
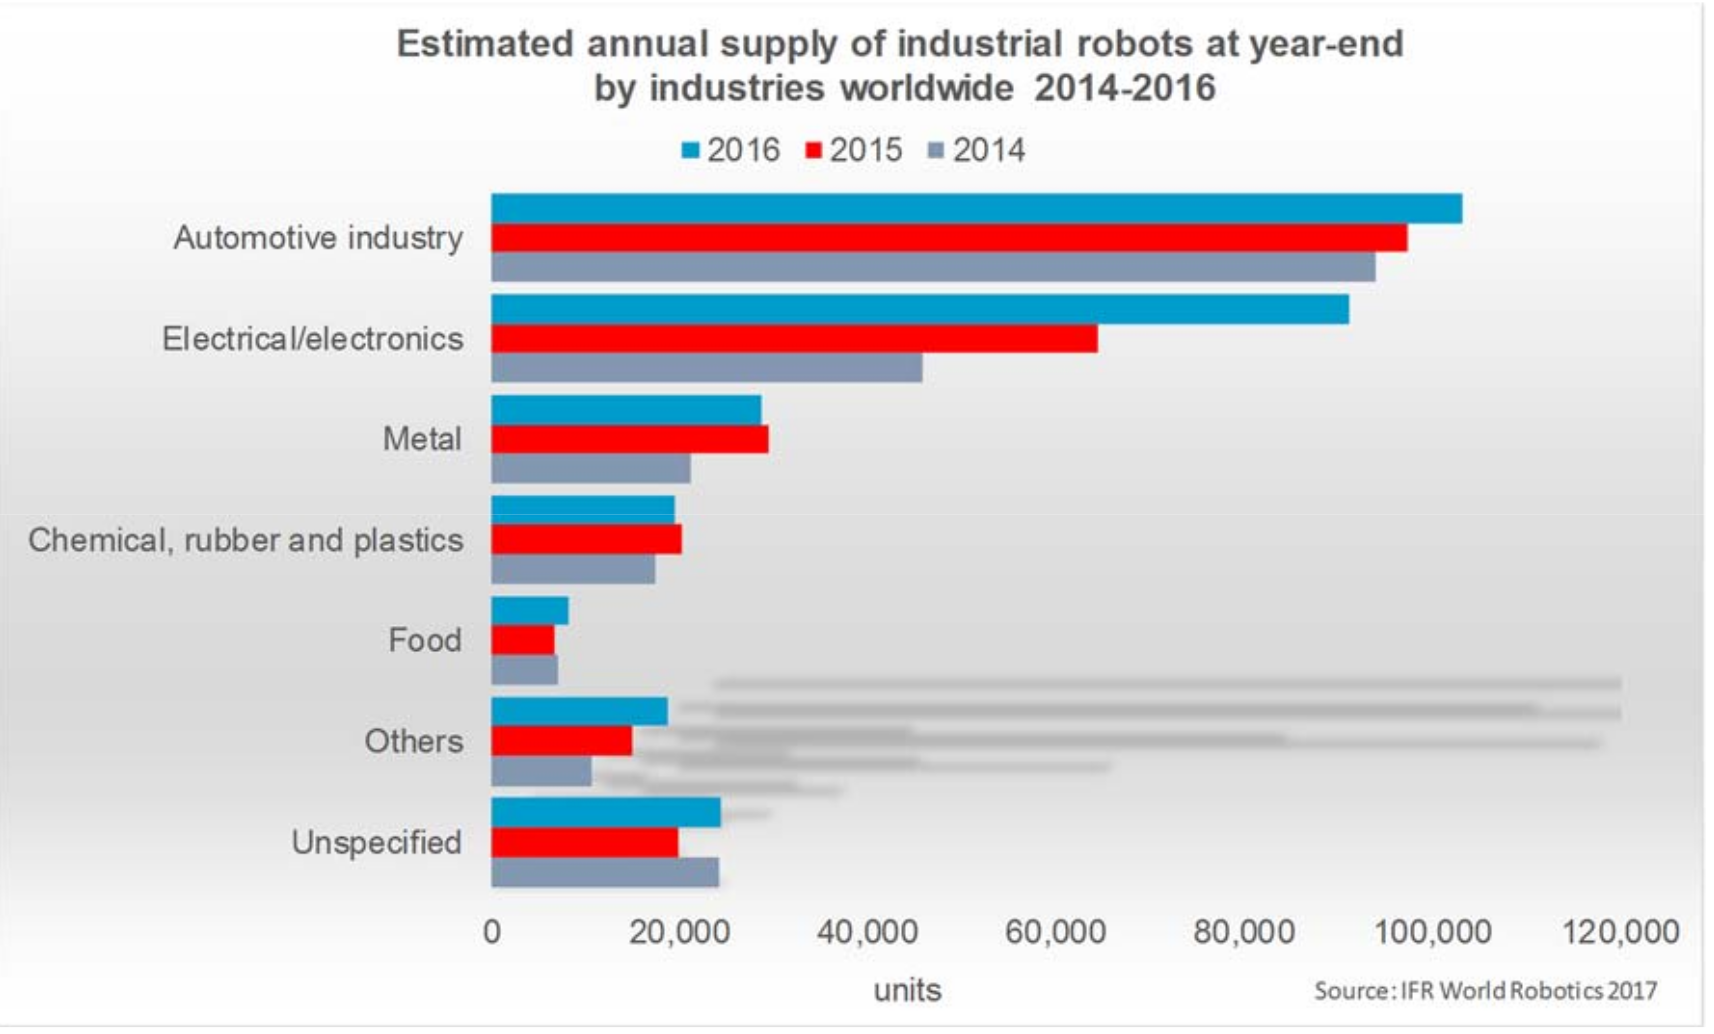
Main driver of the growth: electrical/electronics industry
Between 2010 and 2014, the automotive industry – the most important customer of
industrial robots – considerably increased investments in industrial robots worldwide. In
2015 and in 2016, robot sales further increased but at a lower rate. In 2016, robot
demand of the automotive industry increased by 6% to a new peak of 103,300 units,
accounting for a share of 35% of the total supply in 2016. Between 2011 and 2016, robot
sales to the automotive industry increased by 12% on average per year (CAGR). Since
2010, investments in new production capacities in the emerging markets as well as
investments in production modernization in major car producing countries have caused
the number of robot installations to rise. Using new materials, developing energy efficient
drive systems, as well as high competition in all major car markets, pushed for
investments despite the existing overcapacities.
Executive Summary World Robotics 2017 Industrial Robots
Robot sales to the electrical/electronics industry (including computers and equipment,
radio, TV and communication devices, medical equipment, precision and optical
instruments) were significantly up since 2013. In 2016, sales increased by 41% to a new
peak of 91,300 units, accounting for a share of 31% of the total supply in 2016. Between
2011 and 2016, the average annual growth rate was 19%. The rising demand for
electronic products and new products, the need to automate production and the
increasing need for batteries, chips and displays, were driving factors for the boost in
sales. The production facilities are mainly in Asian countries.
In 2016, sales to the metal and machinery industry slightly decreased by 3% to 28,700
units, down from the peak of 29,450 units in 2015. Since 2010, sales of all subsectors
(basic metals, metal products, industrial machinery) have followed an increasing trend.
Between 2011 and 2016, the average annual growth rate was 15%.
The rubber and plastics industry has continuously increased the number of robot
installations since 2009 from about 5,800 units to 17,300 units in 2015, a new peak. In
2016, sales declined by 8% to 16,000 units. Share of the total supply in 2016 was about
5%. Between 2011 and 2016, sales were up by 9% on average per year. The food and
beverage industry also increased robot orders in 2016 by 20% to almost 8,200 units,
accounting for a share of 3% of the total supply. Sales continuously increased between
2010 and 2014, but it decreased in 2015. The annual average growth rate between 2011
and 2016 was 12%.
Sales to all industries, except for automotive and electrical/electronics, increased by 5%
in 2016. Between 2011 and 2016, the average growth rate per year was 13%. The
respective growth rate for the automotive industry was 12% and for the
electrical/electronics industry 19%. This is a clear indication that not only the main
customer industries (automotive industry and electrical/electronics industry) have
substantially increased robot installations in recent years, but other industries have done
so as well.
Executive Summary World Robotics 2017 Industrial Robots

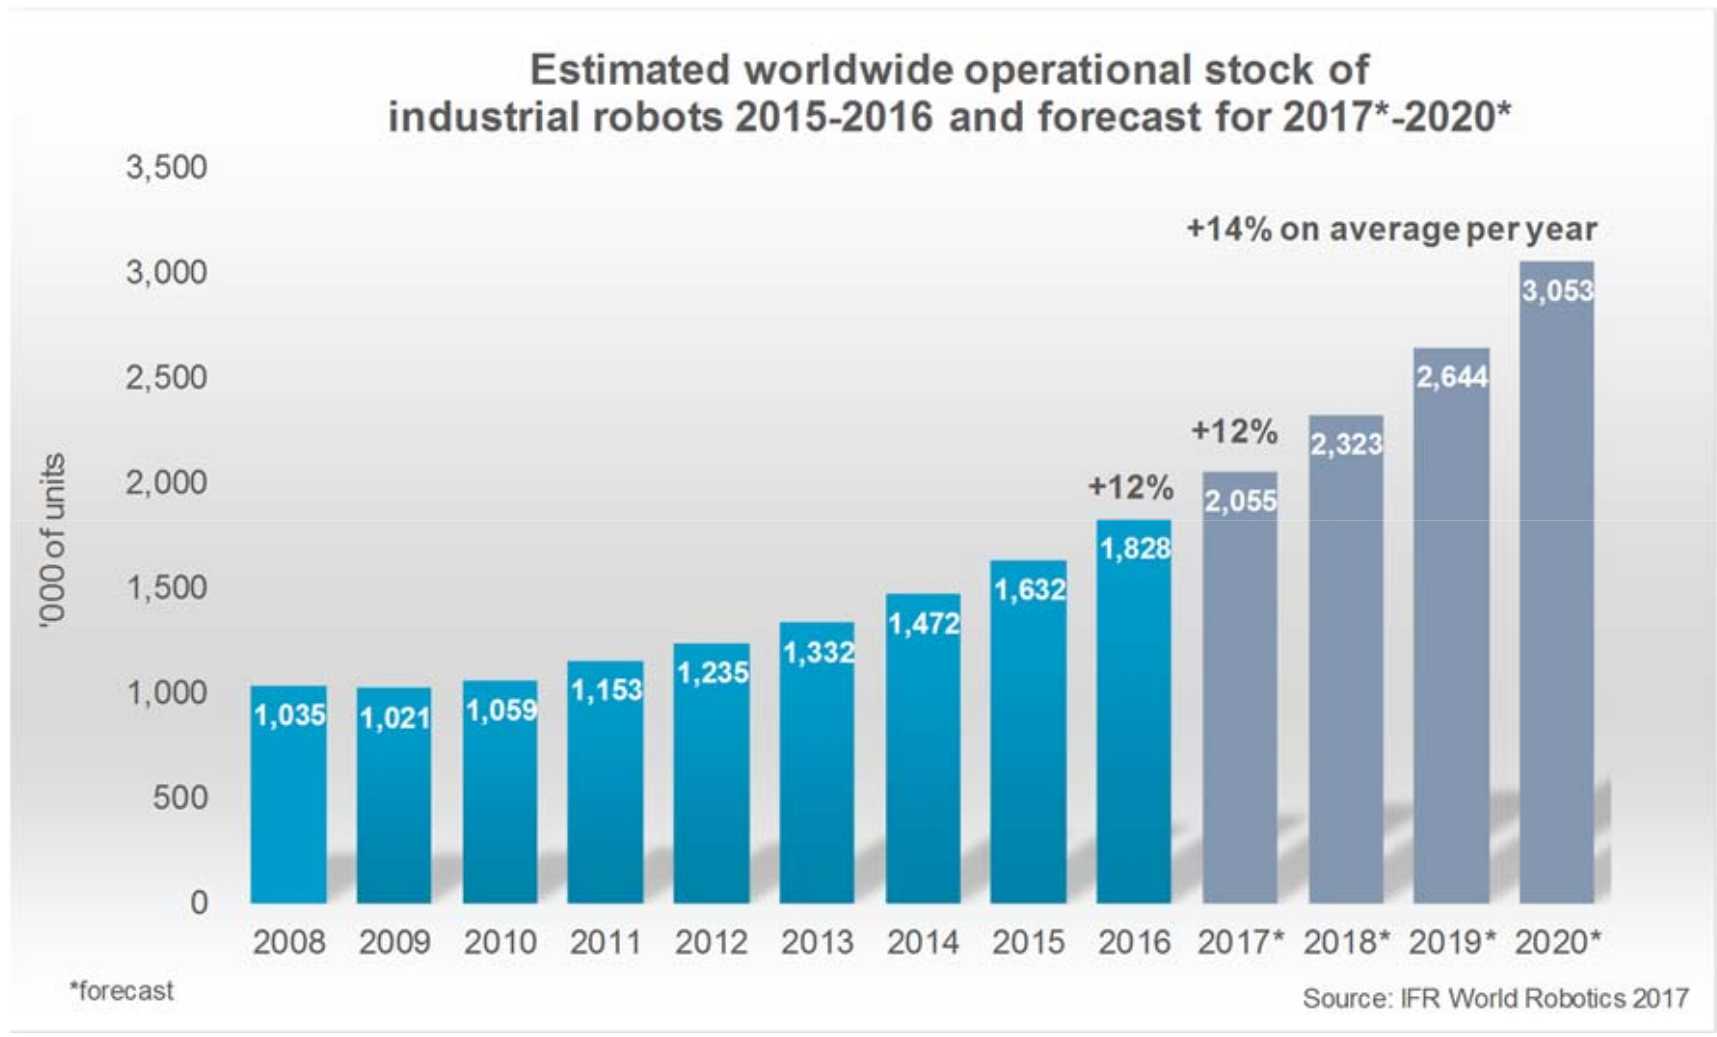
Continued considerable increase of worldwide operational stock
The total worldwide stock of operational industrial robots at the end of 2016 increased
by 12% to about 1.8 million units. Since 2010, the stock has been increasing
considerably by 10% on average per year.
Value of the global market was up to US$13.1. billion
In 2016, the sales value increased by 18% to a new peak at US$13.1 billion. It should be
noted that the figures cited above generally do not include the cost of software,
peripherals and systems engineering. Including the mentioned costs might result in the
actual robotic systems’ market value to be about three times as high. The worldwide
market value for robot systems in 2015 is therefore estimated to be US$40 billion.
Robot density unveils high potential in many countries
When comparing the distribution of multipurpose industrial robots in various countries,
the robot stock, expressed in the total number of units, can sometimes be a misleading
measure. In order to take into account the differences in the size of the manufacturing
industry in various countries, it is preferable to use a measure of robot density. One such
measure of robot density is the number of multipurpose industrial robots per 10,000
persons employed in manufacturing industry or in the automotive industry or in the
“general industry” (which is all industries excluding the automotive industry).
Executive Summary World Robotics 2017 Industrial Robots
The average global robot density is about 74 industrial robots installed per 10,000
employees in the manufacturing industry in 2016. The most automated countries in
the world are the Republic of Korea, Singapore, Germany and Japan.
The Republic of Korea has by far the highest robot density in the manufacturing industry
since 2010. 631 industrial robots were in operation in 2016 per 10,000 employees17. The
rate has been increasing from 311 units in 2010 due to continued installation of a large
volume of robots since 2010 particularly in the electrical/electronics industry and in the
automotive industry. Singapore follows with a rate of 488 robots per 10,000 employees
in 2016. Due to a very low number of employees in the manufacturing industry – some
240,000 employees are estimated by ILO – and a large number of installed robots, the
robot density is very high. About 90% of the robots are installed in the electronics industry
in Singapore, which has increased its number of robot installations significantly in recent
years. Germany ranked third in 2016. The robot density continued to increase to 309
units in 2016. In 2016, Japan ranked fourth for the first time. Up to 2009 Japan had the
highest robot density worldwide. But since 2010 the Republic of Korea and since 2015
Singapore have topped Japan in this respect. Japan’s robot density has been declining
since 2009. In 2016, 303 robots were installed per 10,000 employees in the
manufacturing industry.
The development of the robot density in China was the most dynamic one in the world
due to the significant growth of robot installations in recent years. Particularly between
2013 and 2016, the rising rate of robot density accelerated in China, from 25 units to 68
units. Due to the dynamic development of robot installations since 2010, the robot density
in the United States increased significantly from 114 installed robots per 10,000
employees in the manufacturing industry in 2009 to 189 robots in 2016.
In 2016, the average robot density in the following regions was: 99 units in Europe, 84
in the Americas and only 63 in Asia.
The considerable high rate of automation of the automotive industry compared to all
other sectors is demonstrated in the evaluation of the number of industrial robots in
operation per 10,000 employees in automotive industry and in all other industries.
There was a considerable revision of employment data in the automotive industry in the
Republic of Korea based on updated information from the Ministry of Employment and
Industry. As a result, there was a higher number of installed robots per 10,000 employees
in the automotive industry in the Republic of Korea. 2,145 industrial robots were in
operation per 10,000 employees in 2016. This is more than double the volume in 2009
(1,057) and by far the highest level ever reached. Since 2014, a significant number of
industrial robots have been sold to the automotive industry in the Republic of Korea.
Huge projects aimed at manufacturing batteries for hybrid and electro cars might be the
reason for this high increase in robot density. In 2016, the United States ranked second
with 1,261 industrial robots per 10,000 employees in the US automotive industry. It is
17 Revised robot density rate 2010 – 2015 due to updated information on the number of employees
in the manufacturing industry from the Korean Ministry of Employment and Industry.
Executive Summary World Robotics 2017 Industrial Robots
followed by Japan which had the highest robot density up to 2012 (1,562 robots per
10,000 employees in the automotive industry). Since then, the rate has been decreasing
to 1,240 robots in 2016. France reached a robot density of 1,150 units, Germany 1,131
units and Spain 1,051 units.
The robot density in the automotive industry in China has increased significantly since
2007 but compared to countries like Korea, Germany, and the United States, it is still on
a rather moderate level (505 units).
The robot density in the general industry (all industries excluding automotive) is still
comparatively low. However, countries with an important electronics industry have a
higher rate. The Republic of Korea is on top with 475 robots installed per 10,000
employees. It is followed by Japan with 214 robots, Germany with 181, Sweden with 164
units. Germany and Sweden do not have any important production sites regarding the
electronics industry. The comparatively high rate in both countries is due to a more
diversified distribution of industrial robots in all industries. The increasing automation in
the production of electronic devices will push robot installations within the related
production hubs, particularly in Asian countries. Most of the emerging robot markets have
a robot density rate that is below 30.
The overall conclusion indicates that in almost all surveyed countries, the potential for
robot installations in the general industry is tremendous. It is also considerably high in
the automotive industry among the emerging markets and in some traditional markets
as well. Moreover, continued necessary modernization and retooling also guarantee
further robot investments in already highly automated countries. Relocation of
productions abroad may result in declining investments in that country. However, robot
investments will be shifted to the new production base in another country.
Bright and challenging prospects for industrial robot installations:
Industry 4.0, linking the real-life factory with virtual reality, will play an increasingly
important role in global manufacturing.
Collaborative robots, IoT and Machine Learning/AI will lead robotics in the coming
years.
The new generation of lightweight robots enables man and machine to work closely
and safely together – without fences.
Robots will acquire or adapt new skills through learning processes.
Smarter robots with a “brain” in the cloud as a basis will benefit from big data and
collective learning.
Simplifications – Ready to use applications are getting more popular with the
customers.
Global competition requires continuous modernization of production facilities.
Energy-efficiency and using new materials require continuous retooling of
production.
Growing consumer markets require expansion of production capacities.
Executive Summary World Robotics 2017 Industrial Robots
Decline in products’ life cycle and increase in the variety of products require flexible
automation.
Continuous quality improvement requires sophisticated high tech robot systems.
Robots improve the quality of work by taking over dangerous, tedious and dirty jobs
that are not possible or safe for humans to perform.
Continued strong demand from the automotive industry – investments in eco-friendly
driving systems.
Increasing demand from the electrical/electronics industry.
Increasing demand from the metal and machinery industry, the rubber and plastics
industry, the food and beverage industry.
Small and medium sized companies will increasingly use industrial robots.
China will remain the main driver of the growth.
Continued considerable increase of robot installations in all other growing Asian robot
markets, e.g. India, Taiwan and other Southeast Asian markets.
Continued increase in Japan and in the Republic of Korea.
Continued significant increase in North America – general industry catching up.
Accelerating growth of robot sales in Central and Eastern Europe.
Continued growth of robot sales in Western Europe.
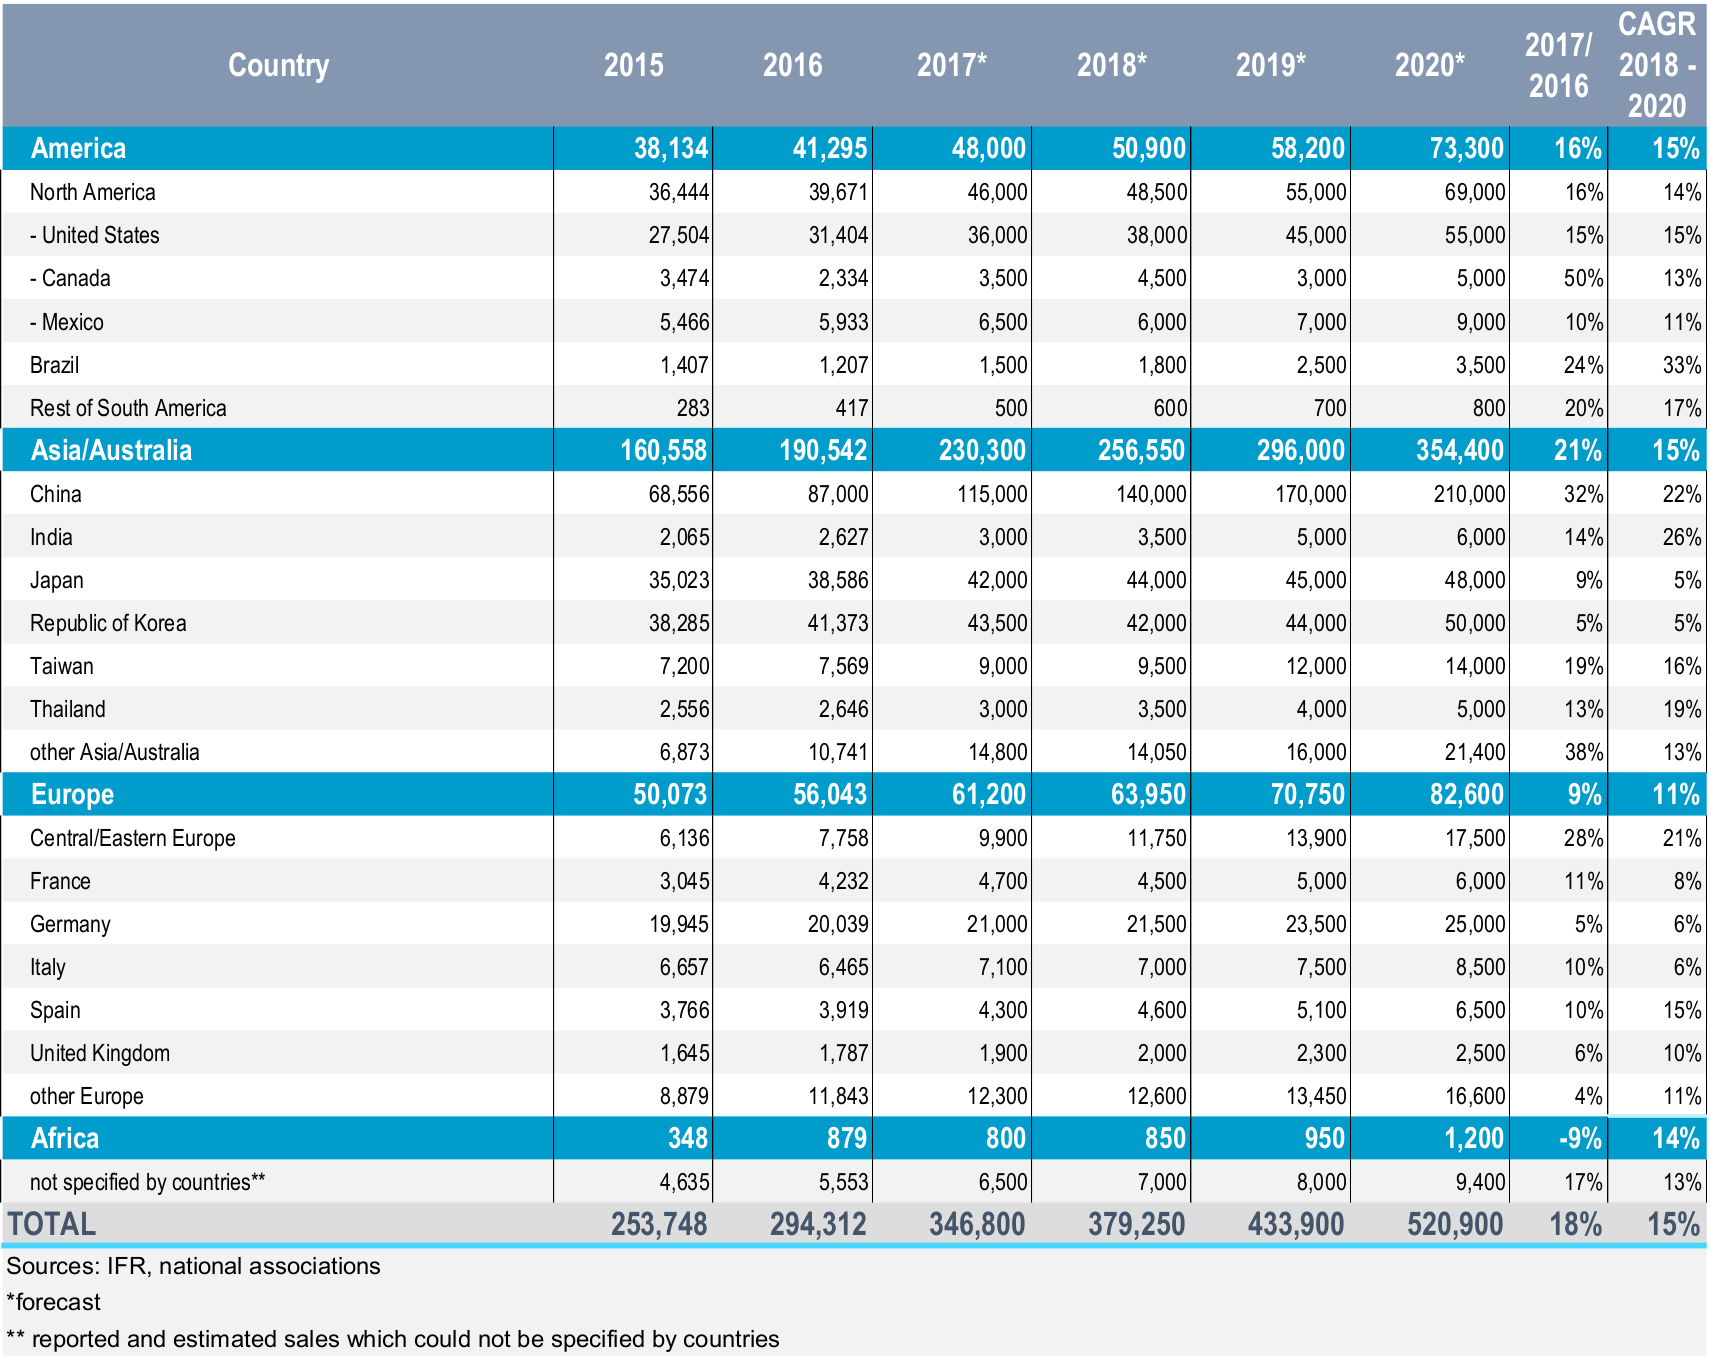
Global robot installations are estimated to increase at least by 18%, to about
346,800 units in 2017. Robot supplies in the Americas will increase by 16%, in
Asia/Australia by 21%, and in Europe by 8%.
From 2018 to 2020, global robot installations are estimated to increase by at least 15%
on average per year (CAGR): 15% in the Americas and in Asia/Australia, and 11% in
Europe. Total global sales will reach about 520,900 units in 2020. Between 2017 and
2020, it is estimated that more than 1.7 million new industrial robots will be installed in
factories around the world.
Executive Summary World Robotics 2017 Industrial Robots
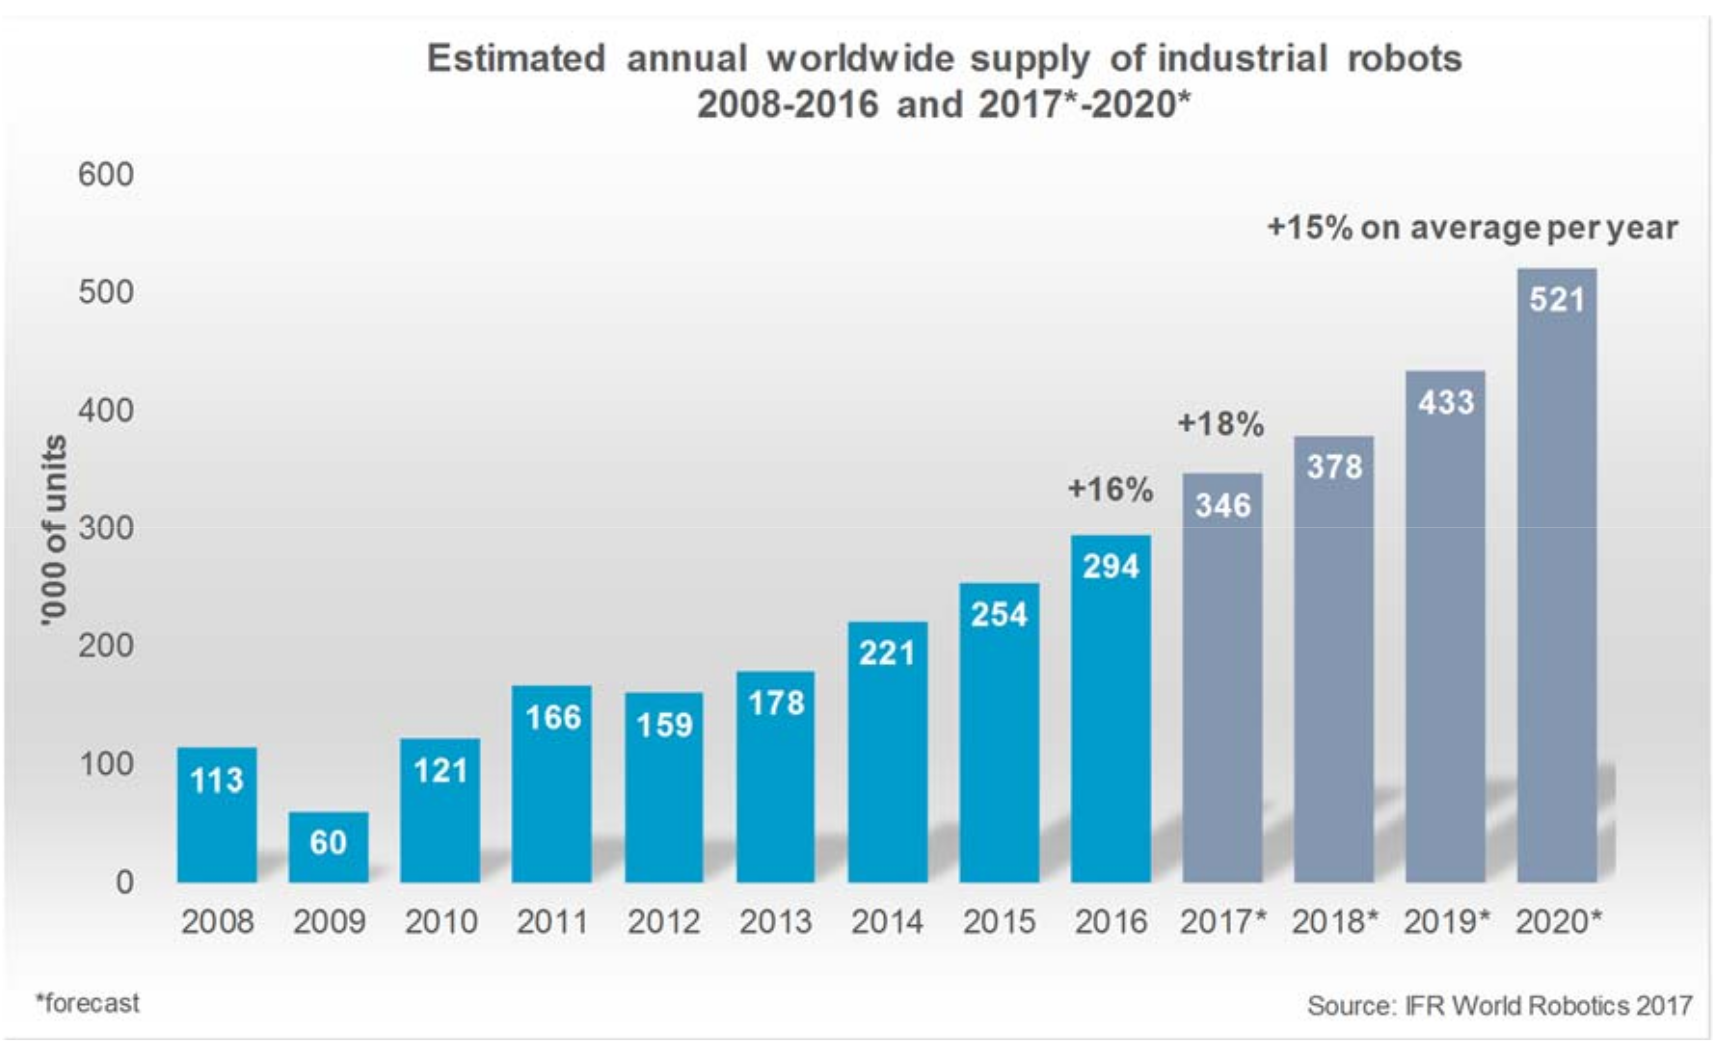
Table 4.1 Estimated annual shipments of multipurpose industrial robots in selected countries.
Number of units
It is estimated that the worldwide stock of operational industrial robots will increase
from about 1,828,000 units at the end of 2016 to 3,053,000 units at the end of 2020,
Executive Summary World Robotics 2017 Industrial Robots
representing an average annual growth rate of 14% between 2018 and 2020. In 2016,
the stock increased by 12% to about 1.8 million units.
The operational stock of robots in 2017 is estimated to increase by 9% in the Americas,
by 16% in Asia/Australia, and by 7% in Europe. Between 2018 and 2020, the stock will
increase by 12% on average per year in the Americas, by 17% in Asia/Australia, and by
7% in Europe.